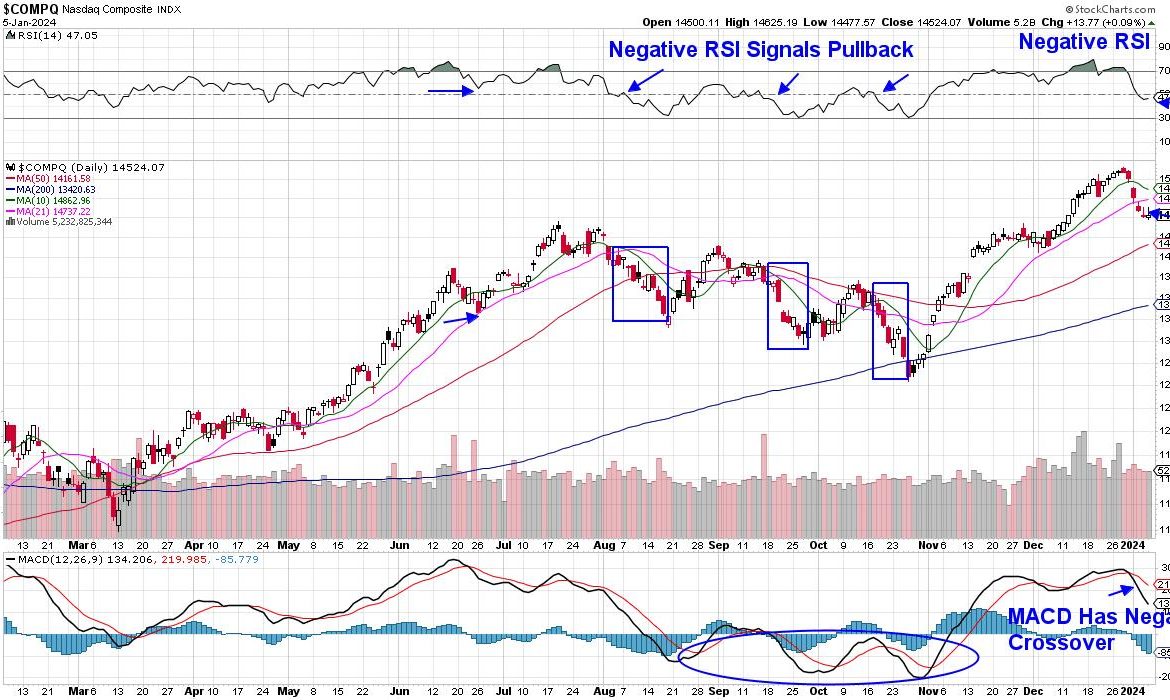
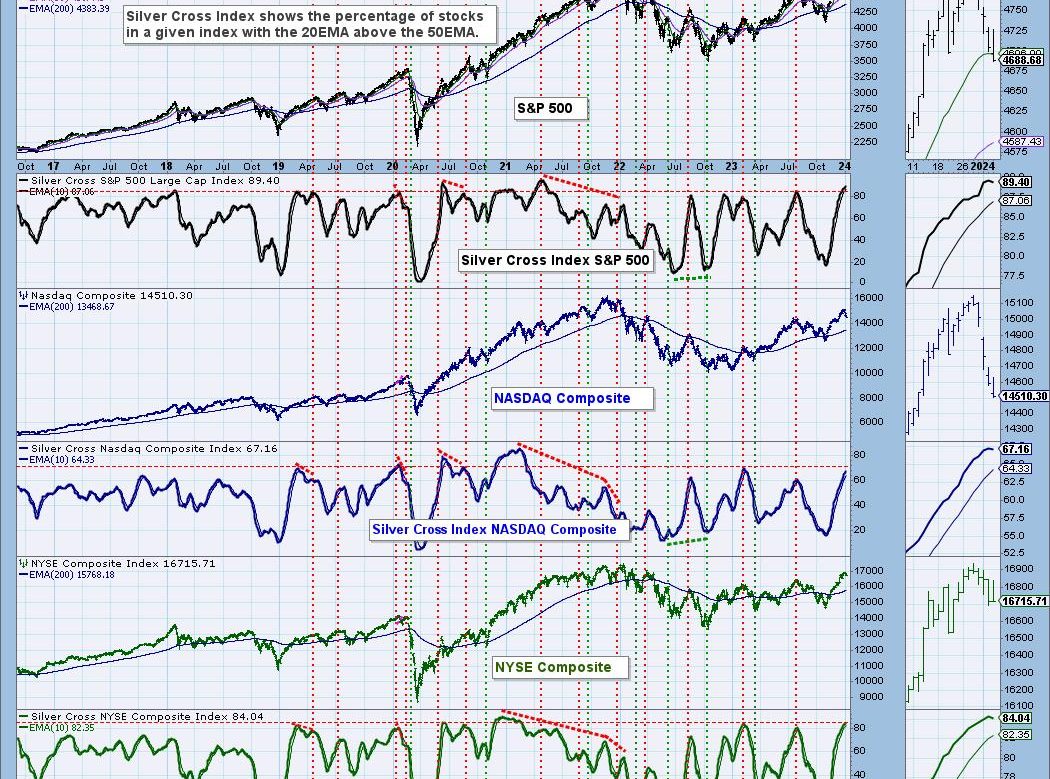
Three Charts to Track Impending Doom
Okay, I literally tried to think of the most bearish headline possible. To be clear, though, I'm actually still bullish on the long-term
Not a great start to the year! In this episode of StockCharts TV's The MEM Edge, Mary Ellen takes a look at where the
Last week, Growth stocks came under selling pressure, with the Nasdaq falling over 3% amid sharp declines in most of the Magnificent
You can't blame the market for taking a breather after nine positive weeks. The first trading week in January ended lower, which may
On this week's edition of StockCharts TV's StockCharts in Focus, Grayson kicks off the New Year by hooking you up with every chart you
On this week's edition of Moxie Indicator Minutes, TG highlights the continuing market pullback that started right around the turn of the
On inflation I like this quote- "Goods deflation likely transitory as downward pressure on goods demand and input costs are fading. 1H24 global core
S&P 500 earnings are in for 2023 Q3, and here is our valuation analysis. The following chart shows the normal value range of
HAPPY NEW YEAR!!! (I guess that is still allowed on day 5 ..) Let's kick off the start of the new year with
(Below is an excerpt from the subscriber-only DecisionPoint Alert on DecisionPoint.com for Thursday, 1/4): Most are familiar with what a "golden cross" is,